Unified Observability Platform
Metrics, logs, and traces.
One platform. No glue.
Metrics, logs, and traces in a single cloud platform. Built in Rust with Apache Arrow for fast ingest, flexible query paths, and tiered storage.
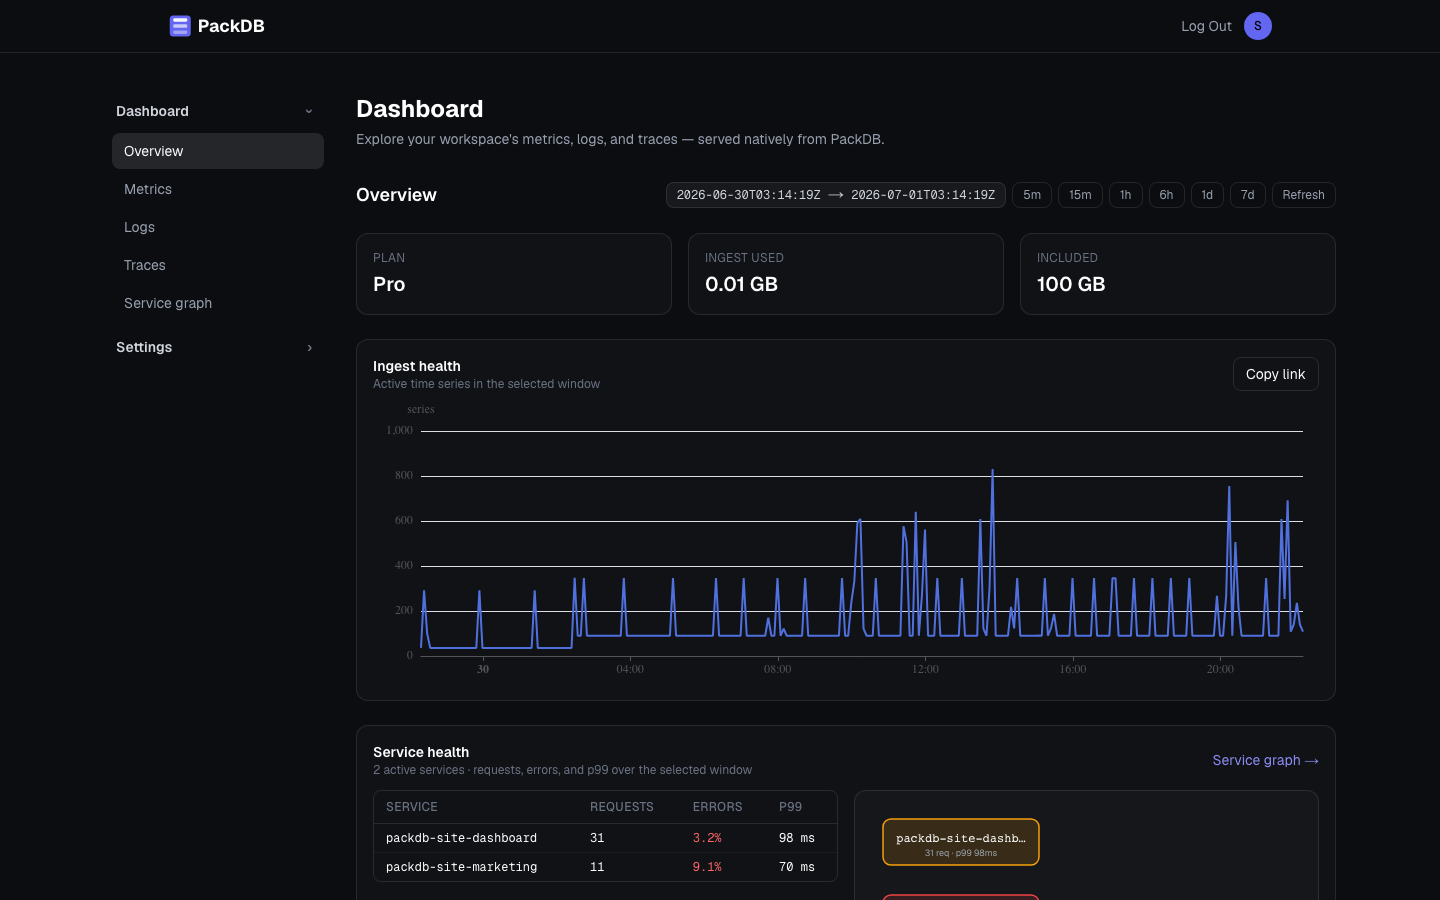
One workflow, no tab-hopping
Follow the whole investigation
Start at the service graph, follow a slow or failing request into its trace, and open the logs that span emitted — with that service's metrics a click away on the same window. All in one platform, without exporting to another tool.
- 1
Service graph
Spot the service that's erroring or slow in the dependency map.
- 2
Trace
Open a representative trace and walk the spans to the culprit.
- 3
Logs & metrics
Open the logs that span emitted, or that service's metrics, on the same window.
- 4
Evidence
Copy a link that reopens the query and window — or the selected trace and span — in the incident.
Bounded SQL evidence
Ask a precise question. Keep its limits visible.
Query metrics, logs, or traces with read-only SQL. Every signal scan stays inside the selected time window, while plan limits cap rows, response size, and execution time.
- PostgreSQL-style
date_bin()examples - Estimated bytes scanned, partial-result causes, and truncation shown with the result
- Copyable links preserve the SQL, workspace pointer, and exact evidence window
SELECT date_bin(INTERVAL '5 minutes', timestamp,
                TIMESTAMP '1970-01-01') AS bucket,
       count(*) AS events
FROM logs.api
WHERE timestamp >= TO_TIMESTAMP_NANOS(:window_start_ns)
  AND timestamp <= TO_TIMESTAMP_NANOS(:window_end_ns)
GROUP BY bucket
ORDER BY bucket
Rows
42 / 1,000
Estimated scan
2.4 MiB
Completeness
Complete
Sending data in 2 minutes
Point your OpenTelemetry collector at PackDB. That's it.
# otel-collector-config.yaml
receivers:
  otlp:
    protocols:
      grpc:
      http:

processors:
  batch:

exporters:
  otlphttp/packdb:
    endpoint: "https://ingest.packdb.io"
    headers:
      x-api-key: "<YOUR_PACKDB_API_KEY>"
    compression: gzip

service:
  pipelines:
    metrics:
      receivers: [otlp]
      processors: [batch]
      exporters: [otlphttp/packdb]
    logs:
      receivers: [otlp]
      processors: [batch]
      exporters: [otlphttp/packdb]
    traces:
      receivers: [otlp]
      processors: [batch]
      exporters: [otlphttp/packdb]
Then verify your first telemetry and run your first queries in the quickstart.
The workflows, not the feature list
Every card is something you do in the product today — and links the proof.
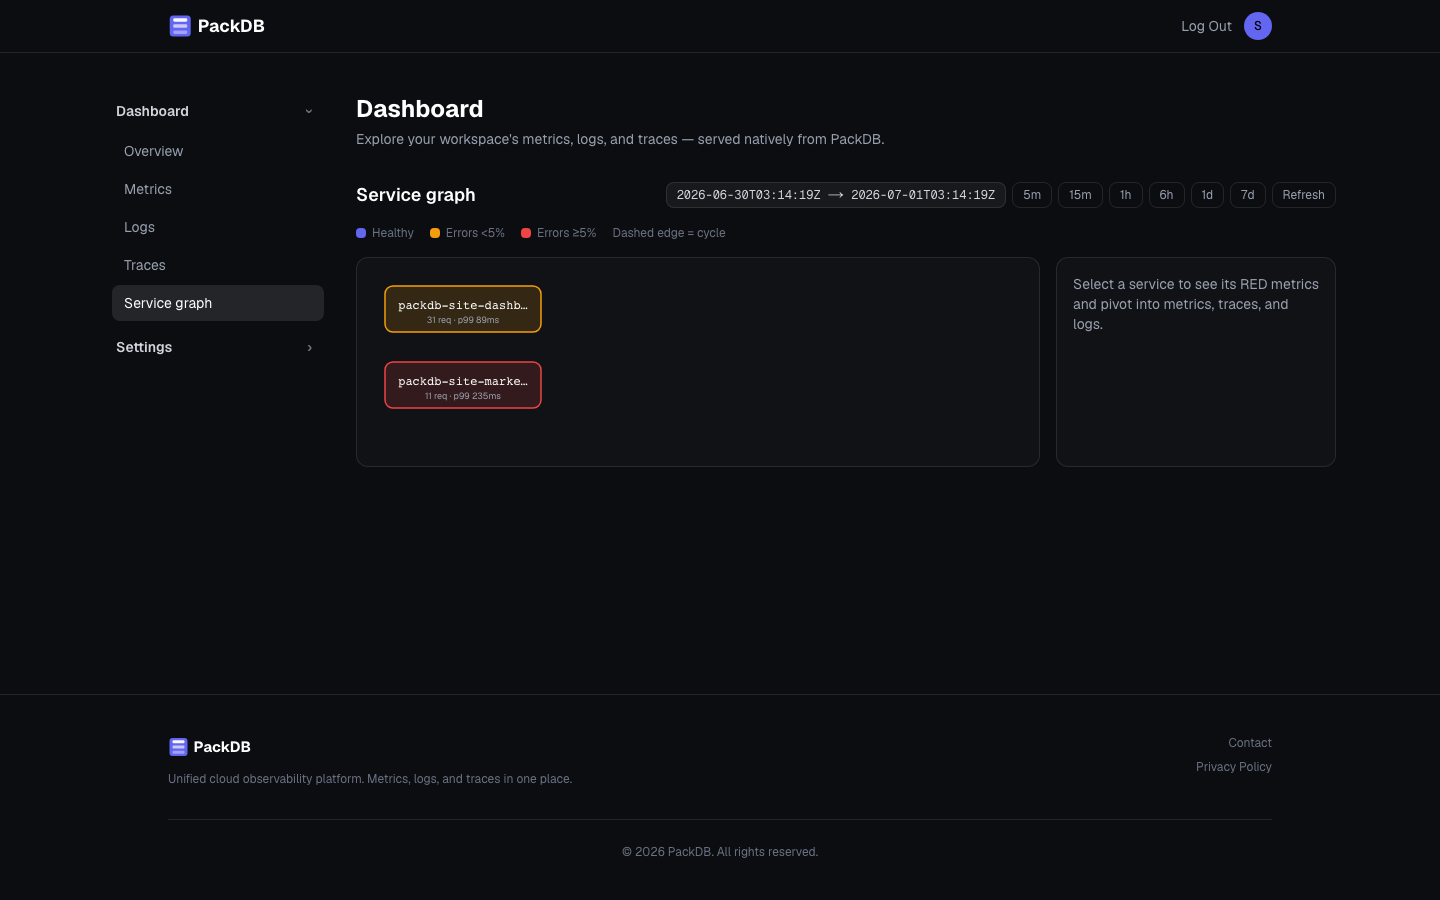
Investigate from the service graph
Spot the erroring service in the dependency map, open a representative trace, and jump from a span straight to the logs it emitted — or to that service's metrics over the same window. One platform, no tab-hopping.
Watch the investigation loopSend data in minutes
Point your OpenTelemetry collector at PackDB with one exporter block, then verify each signal is flowing from the workspace readiness checks.
Follow the quickstartKeep your Grafana dashboards
Provision Prometheus, Loki, Tempo, and Jaeger datasources against PackDB with one API key — existing Prometheus dashboards import unchanged.
Set up the datasourcesQuery in your language
PromQL for metrics, LogQL for logs, TraceQL for traces, and SQL over FlightSQL or REST for cross-signal analytics — plus a Jaeger-compatible API for the tooling you already run.
Browse the docsLink evidence in incidents
Use Copy link in the explorer to preserve the query and time window — or the selected trace and span — behind an incident claim.
See it in the product tourPredict your bill
One included telemetry bucket across all three signals and a single flat overage rate — the whole usage charge fits in one line of arithmetic.
See full pricingBring your own Grafana
Keep Grafana. Add PackDB.
PackDB speaks the Prometheus, Loki, Tempo, and Jaeger query APIs, so existing Grafana can connect through standard datasource types — no plugin, and datasource-backed workflows stay in Grafana.
Prometheus
MetricsPromQL-compatible endpoint; existing Prometheus dashboards import unchanged.
Loki
LogsLogQL-compatible endpoint for log queries and Explore.
Tempo
TracesTraceQL trace search in Grafana Explore, over the same workspace key.
Jaeger
TracesJaeger-compatible trace exploration for existing setups.
Usage-based, no surprises
Costs you can predict
One telemetry bucket across metrics, logs, and traces, then a single flat overage rate — not a separate meter per signal. Enterprise terms stay sales-led.
One included bucket
100 GB/mo
on Pro across every signal; 5 GB on the 90-day free evaluation.
Flat overage
$0.50/GB
beyond your bucket — the same rate for metrics, logs, and traces.
Retention
30 days
on Pro (14-day on Free), across every signal.
Example: 130 GB in a month on Pro = $49 base + 30 GB × $0.50/GB = $64/month. That's the PackDB usage charge before taxes.
Works with your existing stack
Compatible APIs mean no migration headaches.
Start observing in minutes
90-day evaluation with 5 GB/month included. No credit card required.
Larger team or procurement requirements? See PackDB for Enterprise or schedule a demo.